SIGCSE 2006 DC Application
Titus Winters (titus@cs.ucr.edu)
Department Computer Science & Engineering
Engineering Building Unit II Room 465
University of California at Riverside, 92521
Phone: 909 262 0385
Keywords: accreditation, data mining, curriculum assessment
Personal Homepage:
http://www.cs.ucr.edu/~titus
Advisor: Tom Payne (thp at cs ucr edu)
Topic Grouping of Questions for Assessment
Introduction
Instigated by the recent press for "continuous improvement processes"
in education [1], our project seeks
to build a system capable of numerically quantifying the level of
coverage and student understanding for the various topics that make up
each course in our curriculum [7]. Our
ultimate goal for the project is to answer questions like:
- Were linked-lists covered more this semester than in the previous
offering?
- Did students get more binary search questions correct this semester
than in the previous offering?
- Which topics this semester had the lowest class averages?
- Which topic does student X have the lowest average on?
It was decided early on in this project that we would focus on making
only minimal changes to existing teaching methods. In particular, we
have developed grading tools that record scores for each student for
each question, rather than only aggregated scores for each student on
a each instrument. Deployment of these tools have been generally
successful, providing us with a rich data source of per-question
scores.
Topic Extraction
The key to answering many or all of our goal questions is being able
to label questions by topic. Having instructors manually identify the
topic for every question asked in a semester was judged as too
onerous, so we rely on finding automated methods for topic extraction.
Our goal is to produce groups of questions that are viewed as testing
the same topic. By examining one or two samples from those groups,
instructors can quickly label the group. This reduces the instructor
workload from one input per question to one input per topic. Once
questions are labeled with topic, the goal questions become simple
averages of the appropriate subsets of the data.
The focus of this work is therefore to find algorithms from data
mining which produce question groupings similar to those that would be
produced by humans. Note that this is not necessarily the same
as finding the "common factors" using educational statistics
techniques like CFA ([6]): we are not looking for unknown factors, we
are looking to match against known factors (topics.)
Evaluation
To evaluate each algorithm we are examining, it is necessary to have
an already-known "correct answer" for each data set. For each class
dataset we are evaluating, we have asked the instructor for that class
to produce groupings of questions that they would regard as correct.
(The instructors are given the text of the question to evaluate this.)
They may produce as many or as few groups as they like, each question
may occur in any number of groups: none if there are no questions like
it, or more than one group if it corresponds to multiple topics.
Given these groups, we extract all pairs of questions that are valid
to be paired together. For each algorithm that we evaluate, we
determine group membership according to that algorithm, and again
create the pairs of questions that are grouped together. The validity
of the algorithm is then measured by determining the overlap between
these two sets of pairs: the "correct" answer, and the generated
answer. Additionally, many algorithms give a "certainty" to each
question. By varying our certainty, we get a parametric plot of
accuracy.
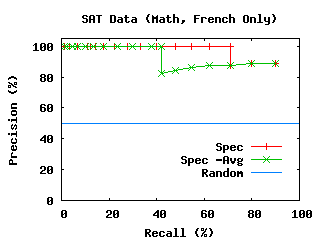
To visualize the correctness of each algorithm, we generate Precision
vs. Recall graphs. As we vary the certainty parameter, starting with
only the questions that are most certain, we get larger and larger
groups of question pairings. For each setting of the certainty
parameter, we evaluate the precision and the recall of
the produced pairing sets. Precision is the percentage of
pairs produced by the algorithm that is present in the correct
answer. Recall is the percentage of pairings in the correct
answer that is produced by the algorithm. Any algorithm can achieve
perfect recall by putting all questions into the same group, but this
results in poor precision. Alternatively, an algorithm
that only reports one group with two correctly-paired questions in it
achieves perfect precision, but poor recall. To maximize
precision and recall simultaneously, the algorithm must produce
exactly the same groups that the humans produced.
Generating Data
Over the past year we have evaluated more than a dozen candidate
algorithms (notably [2-6]) to determine their suitability for this
task. Remarkably, most algorithms perform worse than random
chance on this task. That is, if groupings were made completely at
random, the resulting precision would be greater than the groupings
produced by the candidate algorithms. This indicates that the
algorithms are finding some structure to the data, but it is not
structure that corresponds well with the human notion of "topic."
 With the assumption that the flaw was in the lack of topic structure
in the data, rather than an inability for numerous published
algorithms to perform, we gathered score data from many people on
questions with known topics. We used two 40-question quizzes, one
drawn from Trivial Pursuit questions, and one
drawn from questions out of SAT Subject Test study guides. Both
quizzes had 4 topics with 10 questions each. The Trivial Pursuit
tested Science and Nature, Sports and Leisure, Arts and Entertainment,
and Geography. The SAT tested Math, Biology, World History, and
French. Both were organized as short-answer tests, where the correct
answers were two words or less. A string-matching algorithm was used
to compare given answers against the list of known good answers to
discount misspellings as a source of error, and all of the "incorrect"
answers were checked by hand to ensure that they were in fact
incorrect. Over a period of about a week these quizzes were available
online. The Trivia quiz was completed by 467 participants, the
Academic quiz was completed by 297.
With the assumption that the flaw was in the lack of topic structure
in the data, rather than an inability for numerous published
algorithms to perform, we gathered score data from many people on
questions with known topics. We used two 40-question quizzes, one
drawn from Trivial Pursuit questions, and one
drawn from questions out of SAT Subject Test study guides. Both
quizzes had 4 topics with 10 questions each. The Trivial Pursuit
tested Science and Nature, Sports and Leisure, Arts and Entertainment,
and Geography. The SAT tested Math, Biology, World History, and
French. Both were organized as short-answer tests, where the correct
answers were two words or less. A string-matching algorithm was used
to compare given answers against the list of known good answers to
discount misspellings as a source of error, and all of the "incorrect"
answers were checked by hand to ensure that they were in fact
incorrect. Over a period of about a week these quizzes were available
online. The Trivia quiz was completed by 467 participants, the
Academic quiz was completed by 297.
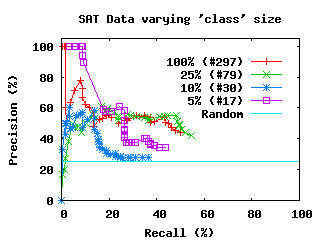
 The results are fairly conclusive. The Academic data
clearly confirms that some topics present a deeper knowledge and
level of understanding, while others are more based on isolated bits
of knowledge. The Math and French questions from the Academic quiz
can be easily separated by most of our algorithms, with accuracy greater
than 85%. Even when the number of "students" in the dataset is
reduced to normal class sizes of 20 to 30, there is sufficient
structure in the Math and French data to separate out these two
subjects. In the whole four-topic data, there is more noise, but the
results are still significantly better than random chance. Depending
on the algorithm utilized for the grouping, precision remains in the
50-60% range.
The results are fairly conclusive. The Academic data
clearly confirms that some topics present a deeper knowledge and
level of understanding, while others are more based on isolated bits
of knowledge. The Math and French questions from the Academic quiz
can be easily separated by most of our algorithms, with accuracy greater
than 85%. Even when the number of "students" in the dataset is
reduced to normal class sizes of 20 to 30, there is sufficient
structure in the Math and French data to separate out these two
subjects. In the whole four-topic data, there is more noise, but the
results are still significantly better than random chance. Depending
on the algorithm utilized for the grouping, precision remains in the
50-60% range.
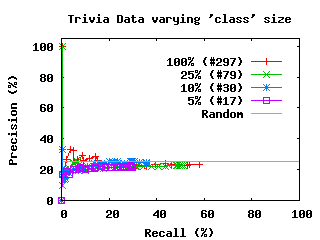
In contrast, the data from the Trivia test behaves poorly. Success in
answering trivia questions does not require deep knowledge of the
topic, but isolated fact retrieval. The trivia data, even with nearly
500 "students" in the dataset, is effectively inseparable, producing
results that are no better than random chance with most algorithms.
On the trivia data, most candidate algorithms produce
worse-than-random results similar to the original class data.
Open Issues
The question that is raised by this work is concerning: Why does
actual class data behave like the trivia data? There are a number
of hypotheses for answering this question, including:
- Student knowledge in class, being tested on material only
recently learned, has not yet been integrated into the whole of their
learning.
- Topic is not the major factor in whether a student can answer a
question correctly.
- Topic only matters in situations where a topic was
unstudied/completely forgotten (like Math or French.)
- The trivia data is somehow a fluke.
With the exception of the final (unlikely) hypothesis, any of the
above are interesting outcomes. This experiment unfortunately appears
to confirm that the goal of a score-based algorithm for grouping
questions by topic is fundamentally infeasable.
Current Stage in my Program of Study
I am scheduled to defend my dissertation in the Spring of 2006.
What I Hope to Gain from participating in the Doctoral Consortium
I have attended the DC for the past two years. In both of those cases
I have come out of the day with a much stronger grasp of both the work
ahead of me as well as the importance of my work and relation between
what I am doing and the rest of the community. Working primarily in
isolation here at UCR, the DC is my major opportunity for seeing
firsthand what other doctoral students in the area are doing, as well
as networking with experts in the field. The Doctoral Consortium is
in many ways the highlight of my academic year. This year it will
come at the perfect time to adjust the focus and emphasis of my
dissertation results. As such, I am highly anxious to participate
again, one last time as a student.
Bibliographic References
- ABET - Accreditation Board for
Engineering and Technology
- Barnes, T. The Q-Matrix Method of Fault Tolerant Teaching in
Knowledge Assessment and Data Mining. PhD Thesis, North Carolina
State University. 2003.
- Gentle, J. E. "Singular Value Factorization." 3.2.7 in
Numerical Linear Algebra for Applications in Statistics. Berlin:
Springer-Verlag, pp 102-103, 1998.
- Lee, D., Seung H. S. Algorithm for
Non-Negative Matrix Factorization. In proceedings, Advances of
Neural Processing Systems v. 13, 2001.
- Ng, A., Jordan, M. On Spectral Clustering:
Analysis and an Algorithm. In proceedings, Advances of Neural
Processing Systems v. 13, 2001.
- Spearman, C. General Intelligence, Objectively Determined and
Measured. American Journal of Psychology, v. 15. pp 201-293. 1904.
- Winters, T., Payne, T. What Do Students
Know? In proceedings, First International Computing Education
Research Workshop (ICER05).