 |
Demetris
Zeinalipour-Yazti Theodoros Folias
Dept. of Computer Science
University of California
Riverside, CA 92507, U.S.A.
{csyiazti,folias}@cs.ucr.edu
Peer-to-Peer (P2P) file-sharing systems such as Gnutella, Morpheus and Freenet have recently attracted a lot of interest from the internet community because they realized a distributed infrastructure for sharing files. Such systems have shifted the Web's Client-Server model paradigm into a Client-Client model. The tremendous success of such systems has proven that purely distributed search systems are feasible and that they may change the way we interact on the Internet. P2P systems uncover many new exciting features such as robustness, scalability and high fault tolerance but with a price. Most research concentrates on optimizing the communication and data model of such systems but inadequate work has been done in area of analyzing such systems. Most approaches tend to use as their basis simulation models which can lead to wrong observations and solutions.
In this project we investigate the behavior of the Gnutella system by analyzing large log traces that we have obtained with gnuDC, our Distributed Gnutella Crawler. We describe gnuDC design and implementation choices and we then describe its architecture. We make an analysis of 56 million messages that we obtained with 17 workstations in a 5 hour interval. We have also done an extensive analysis on IP addresses observed in the gnutella network. We believe that our study will facilitate the design of new more efficient communication algorithms between peers.
All this factors makes it difficult to say how the network looks like and what kind of traffic is traversing the network. We aim to develop an Online Network Traffic Analyzer which will help us to extract network statistics on regular intervals. In this way we may be able to extract some long-term properties which do not change over time.
We need to mention that most research in P2P systems concentrates on
optimizing the communication and data model of P2P
systems [5][6], without
taking into regards the real model of such systems. Most approaches
tend to use as their basis simulation models which can lead to wrong
observations and solutions. There are many reasons for obtaining an
accurate network model with properties that do not change over time.
Some of the main reasons, which are also summarized in
[2], are the following:
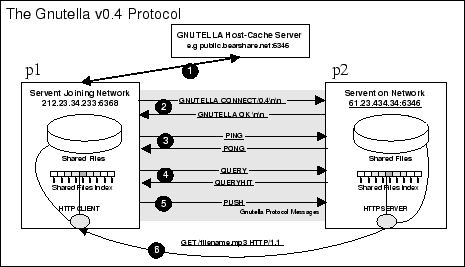
Gnutella's distributed search protocol [30] allows a set of peers, servents or clients, to perform filename searches over other clients without the need of an intermediate Index Server. The Gnutella network topology is a pure Ad-Hoc topology where Clients may join or leave the network at any time without affecting significantly the overall operation of the network. The Protocol hence, is designed in a highly fault-tolerant fashion with a quite big overhead of synchronization messages traveling through its network. All searches are performed over the Gnutella network while all file downloads are done offline. In this way every servent that needs to serve a file launches a mini HTTP 1.1 web server and communicates with the interested servents with HTTP commands.
The core of the protocol is comprised of a set of descriptors which are used for communication between servents and also sets rules for the inter-servents descriptors exchange. These descriptors are Ping, Pong, Query, QueryHit and Push. Ping messages are sent by a servent that needs to discover hosts that are currently active on the network. Pong messages on the other hand are responses to Ping requests every time a host wants to come in communication with the peer that requests to join the network (Figure 1, step 3). Although the protocol doesn't set any bound on the amount of incoming or outcoming connections from a particular host, most Gnutella clients come with a default value for these parameters. A client joining the Gnutella network for the first time may of course not have any clue regarding the current topology or his neighboring peers making the connection to the network impossible. For this reason most client vendors have setup Host-Caches Servers which serve clients with IP addresses of servents currently connected to the network (step 1). Another mechanism which is widely deployed, but is not part of the protocol, is the use of local caches of IP addresses from previous connections. In this way a servent doesn't need to connect to an IP acquisition server (i.e. a host-cache) but can rather try to establish a connection with one of its past peers.
Right after a peer has obtained a valid IP address and
socket port of another servent it may perform several queries
by sending Query descriptors and receive asynchronously results
in QueryHit descriptors (step 4). Step 6 shows how a servent
![]() may download a file from another servent
may download a file from another servent ![]() . This procedure
is done offline with the HTTP protocol. If the servent
. This procedure
is done offline with the HTTP protocol. If the servent ![]() is
firewalled, then
is
firewalled, then ![]() may request from
may request from ![]() , with a Push
descriptor (step 5), to "push" the file.
, with a Push
descriptor (step 5), to "push" the file.
There are several efforts of analyzing the traffic of large-scale P2P systems. Although most of them come from the academic environment, recently companies such as Limewire have also shown an increased interest in analyzing Gnutella's Network Traffic.
In this section we will describe some of the most important developments in the area of Analyzing P2P Network Traffic and Modeling P2P systems.
These questions are probably difficult to answer given
that many of the systems analyzed in this report are proprietary
(e.g. SETI@Home) or hold certain properties (e.g. Magi works with X.509
certificates) which makes their analysis difficult. This is probably
also the reason why most P2P new ideas are implemented on top of
Gnutella which is an open protocol; it is popular and extremely
interesting from the technical point of view.
Simulating a Peer-to-Peer system can usually provide a researcher with some useful insights in the nature of the system. However simulations in most cases don't capture the big picture since initial assumptions and configuration settings may change final results significantly. The Anthill Project [10] developed at the University of Bologna uses Jtella [9] Java API as a basis for building a fully customizable API for the Gnutella network. The aim of the project is to create a simulation framework which will allow researchers to develop and validate new P2P algorithms. The system itself is inspired from the biological metaphor of Ant colonies. Although the project doesn't emphasize particularly on P2P case studies, it is worth it to mention that they are currently using their framework to investigate the properties of the Freenet [31] algorithm by modifying its protocol and comparing the performances of different implementations.
Their framework intends to obtain:
Although Anthill uses the notion of scenarios, which is composed of a collection of interconnected nodes and a scheduling of requests to be performed, there is no documentation on that. Nevertheless we mention that typical Simulation Test beds usually have of two components: (1) The Network Graph Generator and (2) the Network Nodes. A P2P Simulator is also described in the appendix of [13].
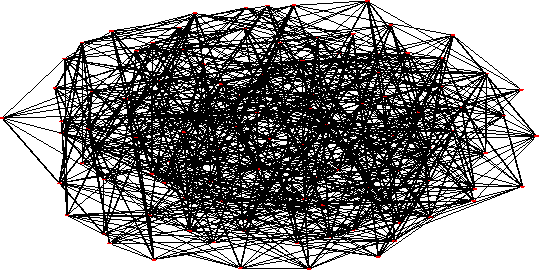
Other Simulators, such as ours, can also generate outputs which can be piped into Visualization Tools, such as GraphViz [14], and generate graphical representations of the network topology.
Figure 2, presents a random graph generated with our Network Graph Generator using
Graphviz's dot 2D undirected graph layout. It is important to mention that generating visualizations for
huge graphs can take a considerably large amount of time and may finally not provide the adequate
help in understanding how the network looks like. Visualizing P2P network graphs is described
in some extend in [2]. They try to visualize the Gnutella backbone (i.e. inter-connected
nodes with ![]() ) rather than the whole network in order to obtain some more understandable results.
We believe that Visualizations provide "nice" figures but contribute very little in understanding Large-scale
P2P networks.
) rather than the whole network in order to obtain some more understandable results.
We believe that Visualizations provide "nice" figures but contribute very little in understanding Large-scale
P2P networks.
Their study reveals that Gnutella has some important structural properties, such as small-world properties and several power-law distributions of certain graph metrics. They mention the famous Milgram's experiment [21] which was conducted in the early 1960's, and in which a number of letters, addressing a person in the Boston area, were posted to a randomly selected group of people in Nebraska. Each person who received the letter forwarded it to someone that they knew, on a first name basis. As many of the letters finally reached the designated person, the average number of hops observed was between five and six. Their study reveals that a similar, small world property existed in the Gnutella Network. More specifically in 5 different snapshots of the Gnutella Network they found that the diameter of the network ranged from 8-12.
In their work they have also discovered that the Gnutella Network obeys all four of the power-laws
described in Faloutsos et al. work. [1]. More specifically they found, on a
Gnutella snapshot gathered on the ![]() of December 2000, that the Rank Exponent
of December 2000, that the Rank Exponent ![]() (Power-Law 1)
holds with
(Power-Law 1)
holds with ![]() and a correlation coefficient of
and a correlation coefficient of ![]() . It is important to mention that similar results which were obtained
one month earlier by an independent group at U. of Chicago [22]. The same group claims that this power law faded-out
in repeated experiments in the March-June 2001 period.
. It is important to mention that similar results which were obtained
one month earlier by an independent group at U. of Chicago [22]. The same group claims that this power law faded-out
in repeated experiments in the March-June 2001 period.
Jovanovic's study on the same snapshot of data also revealed that the Outdegree Exponent ![]() (Power-Law 2) also holds with
(Power-Law 2) also holds with ![]() ,
although this comes in disagreement with the
,
although this comes in disagreement with the ![]() exponent found in the 6 month earlier study of the DSS [27] group.
exponent found in the 6 month earlier study of the DSS [27] group.
Their study finally shows that the Hop-Plot Exponent ![]() (Power-Law 3) and Eigen Exponent
(Power-Law 3) and Eigen Exponent ![]() (Power-Law 4) hold for
four different snapshots with very high coefficients of
(Power-Law 4) hold for
four different snapshots with very high coefficients of ![]() ,
, ![]() and
and ![]() ,
, ![]() respectively.
respectively.
The general belief is that earlier versions of the Gnutella Network were Power-Law but as the network has grown this property doesn't hold any more. One important fact is that as the Gnutella network became more mature, more intelligent clients were added to the network. Intelligent clients can affect dramatically the way a Network Crawler operates. The latter relies on the fact that clients will respond to its requests but in the case the clients do not comply with this requirement, the Network crawler will generate inaccurate data. We believe that it would be interesting to re-examine the pre-mentioned results since the Gnutella network has undergone significant changes in terms of structure and size.
They are also presenting interesting visualizations of their gathered data, which were visualized with LEDA [23], which is not publicly available anymore. The main disadvantage of their study is that their experiments were performed on a small set of peers (1000), which is not representative of the today's picture of the network. Additionally, their Gnutella Crawler Implementation is in some sense static since it starts from a pre-specified seed file of peers and relies on the fact that it will discover new nodes on runtime.
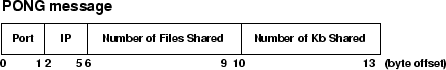
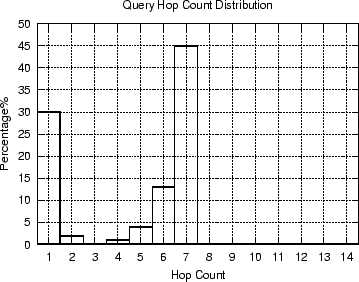
Crawling is usually the most effective approach in order to obtain
real Gnutella Traffic data. The role of Crawlers is usually to attach to a set of ![]() Gnutella
entry-points (i.e. hosts) and harvest various massages that are routed through
these nodes. For example a Crawler might extract from a pong descriptor (Figure 3)
the IP address of a particular peer as well as its path distance (i.e. hop count) from the crawler.
Gnutella
entry-points (i.e. hosts) and harvest various massages that are routed through
these nodes. For example a Crawler might extract from a pong descriptor (Figure 3)
the IP address of a particular peer as well as its path distance (i.e. hop count) from the crawler.
Crawlers may then try to resemble all the gathered data in order to create snapshots or maps of the network. Crawlers are actually affecting the operation of other P2P clients since they decrease their out-degree (and subsequently their horizon), without offering them any exchange (i.e. results on queries). We need to mention that crawling results are not completely accurate since a crawler may not capture a set of peers which belong to a Gnutella sub-graph.
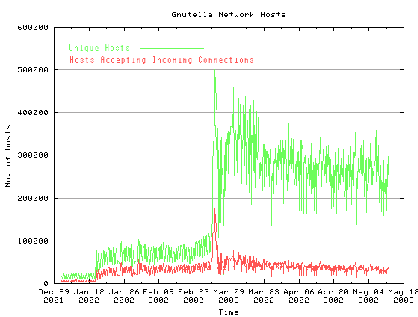
Figure 4, which was obtained from [26],
presents the number of Gnutella Peers and the number of hosts
accepting new connections. Although we can't say exactly how these
data were obtained, since Limewire refused to tell us, we mention
that they were most probably obtained by a combination of Crawling and
by utilizing their Host Caches.
GnutellaMeter [34] is another system which monitors the
traffic patterns of the Gnutella network by attaching itself as a
passive observer to well-positioned peers in the network and by
analyzing search queries and identification messages passing through
the Gnutella network. GnutellaMeter presents the top 300 queries
performed on the Gnutella Network. Their proprietary infrastructure
makes it difficult to conclude how results are
gathered. Also, It is not possible to say whether their results are
real-time or not.
Clip2's DSS Group discovered in [20] several interesting features of the Gnutella network. The study which was conducted in July 2000 showed that the number of unique Gnutella users per day is no less than 10,000 and may range as high as 30,000. They also show that the diameter of the network was 22, indicating that some regions of the network were not in communication with others. The diameter of a network is defined as the longest path between two hosts on the network. The diameter is the opposite to the notion of the shortest path between two hosts. Older results of their experiments, which were obtained two months earlier, show that the diameter was found to be smaller, typically 8 or 9. Some other fact is that a network with few hosts can have a large diameter and vice versa, since it is a function of how hosts are inter-connected and the out-degree, rather than the number of hosts participating in a given topology. This result is particularly interesting to us since it shows that the dynamics of such networks may change significantly in a short period.
Another observation that they have done is that a host was most likely to have a single connection, and hosts with higher numbers of connections were increasingly uncommon which refers to power-law degree distributions. We need to recall, from the previous sub-section, that similar behavior was obtained on about the same time from both Jovanovic et al. and Ripeanu et al.
One final question that their study tried to answer is "What are users searching for?". The DSS Group presents in [20] the set of queries that contained specific types of extensions. The result indicates that most users are interested in audio/video files and far less users are interested in images (which can be obtained more efficiently by Image Search Engines).
The DSS group also verified that Gnutella is a truly international phenomenon, since one of three hosts was found to be located on a non US-centric domain.
Their study analyzed 3.3 million addresses, of which 1.3 million (39%) were resolvable to non-numeric hostnames. On this subset of addresses they found that
the ratio of domination was ![]() for the following domains COM, NET, and EDU and combined {ORG, US, GOV, and MIL} respectively. It is interesting to
repeat such experiments to see how this ratio might have changed since the Gnutella network has changed significantly in size in the meanwhile.
for the following domains COM, NET, and EDU and combined {ORG, US, GOV, and MIL} respectively. It is interesting to
repeat such experiments to see how this ratio might have changed since the Gnutella network has changed significantly in size in the meanwhile.
In this section we will describe design and implementation issues of gnuDC, a large-scale distributed Gnutella Crawler. gnuDC allows us to obtain various large-scale Gnutella network traffic metrics. Crawlers, spiders or bots are well known in the WWW world. These WWW Crawlers [15] typically traverse the hypertext structure of the Web automatically, starting from an initial hyper-document and recursively retrieving all documents accessible from that document. P2P Crawlers on the other hand need to connect to some pre-specified Host-Cache server, obtain a set of peers active in the network, try to connect to these peers and finally discover more and more peers while the operate. A determinant factor between WWW Crawlers and P2P Crawlers is that the second ones try to discover a topology which is highly dynamic. For this reason P2P Crawlers need to be able to discover the entire topology in a relatively small interval. WWW Crawlers on the other hand can operate for weeks or months in order to accomplish their task.
A Large Distributed P2P Crawler needs to hold several properties in order to make the process of discovering a network topology efficient.
Jovanovic et al. study in [2] the design issues of a sequential and parallel P2P crawler. The main drawback of their design is
that it is based on the assumption that an initial set of all peers in the network is available. This was probably a reasonable assumption, on the time
of their study since the largest connected public segment was rarely exceeding ![]() hosts.
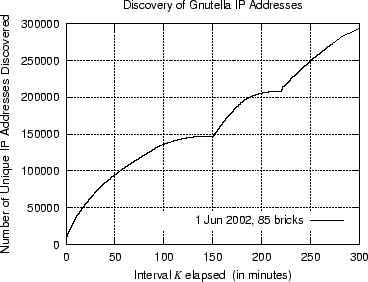
This is obviously not true any more since the Gnutella Network has grown dramatically. In the experimentation section we show that the number
of unique IPs discovered in a 5 hours interval were
hosts.
This is obviously not true any more since the Gnutella Network has grown dramatically. In the experimentation section we show that the number
of unique IPs discovered in a 5 hours interval were ![]() . Below we describe the main factors that guided our design:
. Below we describe the main factors that guided our design:
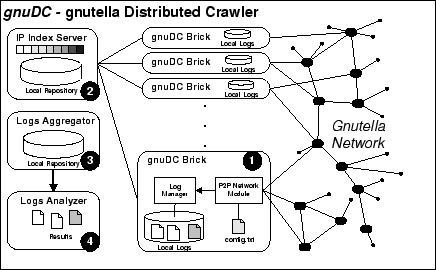
gnuDC is a Gnutella Distributed Crawler which obtains Gnutella network traffic measurements while addressing the four design issues described in the previous section. Figure 5 illustrates the four basic components of gnuDC, the IP Index Server, gnuDC bricks which are standalone Gnutella Clients, an online Log Aggregator and Log Analyzer. These components operate independently and asynchronously. The whole system can easily be deployed on a cluster or network of workstations since it can be bootstrapped by the execution of a single bash script.
IP Index Server is the component responsible for maintaining at runtime an updated list of hosts currently in the network. Every gnuDC Brick, i.e. one of our Gnutella clients participating in the crawling, will establish a permanent socket link upon initialization with the Index Server and feed it with hosts' information as they are discovered. The index server is the only centralized component and hence we have paid close attention to its design and implementation. It is implemented as a Multithreaded Server and can easily be configured to accept one hundred connections. Although the Server maintains an in-memory index structure for the state of each IP currently in the network it also flushes its state to secondary storage with double buffering techniques. In this way it minimizes the I/O cost while providing on the same time persistency.
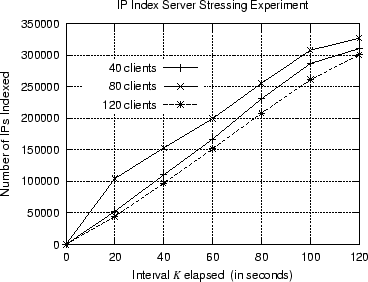
We have conducted several performance experiments with automated clients in order to benchmark the performance limitations
of the IP Index Server. We ran this experiment with ![]() ,
, ![]() and
and ![]() automated clients respectively. Each of the automated clients
was generating random IPs and was submitting them, through the permanent socket link, to IP Index Server.
The Index Server was indexing the IPs in an in-memory data structure while it was also storing, in chunks of 1000 IPs, the new IPs
as they arrived in the system.
automated clients respectively. Each of the automated clients
was generating random IPs and was submitting them, through the permanent socket link, to IP Index Server.
The Index Server was indexing the IPs in an in-memory data structure while it was also storing, in chunks of 1000 IPs, the new IPs
as they arrived in the system.
Figure 6 illustrates that the Index Server can sustain considerably high amounts of load.
Our measurement shows that the IP Index Server was accepting averagely ![]() IPs/sec with a peak of
IPs/sec with a peak of ![]() IPs/sec.
The cost for maintaining the in-memory data structure was averagely
IPs/sec.
The cost for maintaining the in-memory data structure was averagely ![]() for
for ![]() IPs.
We mention that snapshots of the Gnutella Network, maintained by Limewire [26], suggest that there are averagely
IPs.
We mention that snapshots of the Gnutella Network, maintained by Limewire [26], suggest that there are averagely
![]() peers at any given moment. Given that we found it satisfactory to deploy our system since we had averagely
peers at any given moment. Given that we found it satisfactory to deploy our system since we had averagely ![]() in our
availability. In the same figure we can also see that although the optimum number of clients
would be
in our
availability. In the same figure we can also see that although the optimum number of clients
would be ![]() , using
, using ![]() clients has no important performance penalty.
clients has no important performance penalty.
A gnuDC Brick is a Gnutella Client which will connect to the Gnutella Network and Log various messages as they traverse that node.
For the implementation of a gnuDC Brick we have used as a basis the JTella[9] API, which is a Java API for Gnutella.
Each gnuDC Brick configures itself by reading the conf.txt file which contains information such as Maximum Incoming & Outcoming Connections,
Socket Timeouts, Port Number, Log Directory and others. Although the initial port number is identical for all gnuBricks (i.e. port=11000), a
gnuBrick will seek for a different port number if ![]() is occupied. In this way a gnuBrick can start without any particular problem on any machine
it is launched.
is occupied. In this way a gnuBrick can start without any particular problem on any machine
it is launched.
Each gnuBrick maintains a Peer List which contains the IP addresses of known peers in the network. Every time a new IP is discovered or lost the IP Index Server is notified through the permanent socket link which is a Gnutella servent API.
In our experiments we deployed gnuDC on 85 nodes running on 17 workstations. All workstations were AMD Athlons 4, 1.4 GHz with 1GB RAM running Mandrake Linux 8.0 (kernel 2.4.3-20) interconnected with a 10/100 LAN connection. Before launching a massive crawl we performed several test experiments to ensure the stability of our system. On the 1st of June 2002, we performed our first "long" crawl which lasted five hours. After that we performed several other small scale experiments to gather data on specific issues.
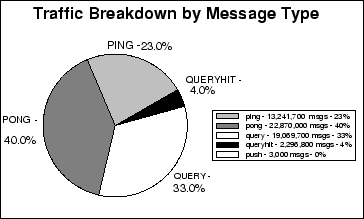
Figure 7 presents the message
breakdown by Message Type. We may see that only a very few Push messages (i.e. ![]() ) were routed through
our cluster and hence they are not presented in the pie chart.
Figure 7 confirms that Gnutella has actually a huge communication overhead (i.e. ping/pong messages), since
it is averagely
) were routed through
our cluster and hence they are not presented in the pie chart.
Figure 7 confirms that Gnutella has actually a huge communication overhead (i.e. ping/pong messages), since
it is averagely ![]() of all the messages. We believe that is due to the fact that Gnutella connections are relatively unstable
which leads peers in a endless effort of discovering new peers rather than to the fact that peers are joining and leaving
the network at fast paces. Pong Stealing might be a reason why a peer is attracting more network load than the load
it can really handle. We define as Pong Stealing when an intermediate node
of all the messages. We believe that is due to the fact that Gnutella connections are relatively unstable
which leads peers in a endless effort of discovering new peers rather than to the fact that peers are joining and leaving
the network at fast paces. Pong Stealing might be a reason why a peer is attracting more network load than the load
it can really handle. We define as Pong Stealing when an intermediate node ![]() is obtaining the ip address, from a Pong message
which is routed through him. In this situation a host
is obtaining the ip address, from a Pong message
which is routed through him. In this situation a host ![]() which replied positively to a ping request of a host
which replied positively to a ping request of a host ![]() might get a connection
request from both
might get a connection
request from both ![]() and
and ![]() although its initial intention was to accept only 1 connection.
This phenomenon might destabilize
although its initial intention was to accept only 1 connection.
This phenomenon might destabilize ![]() current network connections since
current network connections since ![]() is forced to; at least, abort the one of the two requested connections.
Another reason for network instability might be that some "powerful" host
is forced to; at least, abort the one of the two requested connections.
Another reason for network instability might be that some "powerful" host ![]() is routing many messages to another "weak" host "B" with a result
that B is kept so busy that it is not able to handle its rest connections. if
is routing many messages to another "weak" host "B" with a result
that B is kept so busy that it is not able to handle its rest connections. if ![]() is implemented appropriately (i.e. keep different queues for different connections)
then of course such a thing won't occur but our point here is that this really depends on the implementation of each Gnutella client.
is implemented appropriately (i.e. keep different queues for different connections)
then of course such a thing won't occur but our point here is that this really depends on the implementation of each Gnutella client.
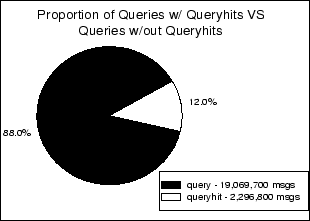
Figure 8 presents the amount of queries routed through our cluster versus the amount of queries that were routed with queryhits. A similar measurement was obtained in [18] where the percentage of Queries with Queryhits varied between 10-12%.
In this subsection we discuss our observations after analyzing ![]() unique queries.
Here we found various interesting patterns such as high locality of specific queries and we were also able to distinguish Gnutella Users
into three classes.
Table 1 presents the ranking of the top 20 queries. We can clearly see
that most queries are submitted in large numbers and hence there exist a high locality of specific queries.
This observation might lead to better caching policies at peers which might cache Queryhits that are posted in response to popular queries.
unique queries.
Here we found various interesting patterns such as high locality of specific queries and we were also able to distinguish Gnutella Users
into three classes.
Table 1 presents the ranking of the top 20 queries. We can clearly see
that most queries are submitted in large numbers and hence there exist a high locality of specific queries.
This observation might lead to better caching policies at peers which might cache Queryhits that are posted in response to popular queries.
Seasonal-Content Searchers are those who are seeking for content that is currently popular, such as new movies or chart songs. Spiderman for example was a popular term since its new movie was released around the time we conducted the experiments. Finally popular TV shows, such as "Seinfeld" were also among the top searches in this category.
Adult-Content Searchers are users which are looking for mature content. These searchers seem not very selective since they are looking for content that contains a general Adult-Content term rather than a specific movie. We have observed from other informal experiments that these users are constant over time and that the text patterns they are searching for are not changing very much.
Finally File Extension Searchers are those which are not looking for something particular but which are rather interested to download anything that may seem interesting to them but which is of a specific file-type (e.g. avi, mp3). In this category we may find for instance a user who is searching for the term "mp3". It is clear that this user has not something specific in its mind but that he is rather interested to "browse" the mp3 files shared by his fellow file-sharers. Our informal experiments, which were conducted in May 2002, show that this category is also showing some constant search patterns over time.
These three categories might actually have a large overlap. For example a user searching for seasonal content might as well perform file extension searches.
Gnutella Users are mainly interested in video media rather than audio media.
This differentiates Gnutella users from other File-sharing applications such as Napster where audio was the only available media.
The trend that most users are seeking for multimedia content might also reveal that they are "bandwidth-capable" of downloading such media.
Finally Gnutella users seem not interested in other type of content such as software, images or text since their aggregate percentage is not very large.
Table 2 presents the demand in specific filetype extensions.
Our analysis indicates that the trends have not changed significantly from the DSS's study which was performed in October 2000.
The table validates that the users in Gnutella are seeking for Multimedia Content (audio/video) since their aggregate exceeds ![]() of all filetypes searched. Although the trend for demand of multimedia in filesharing applications is not new we mention
that the trend nowadays is constantly towards video instead of audio, which was the main media exchanged in the napster [28] community.
of all filetypes searched. Although the trend for demand of multimedia in filesharing applications is not new we mention
that the trend nowadays is constantly towards video instead of audio, which was the main media exchanged in the napster [28] community.
|
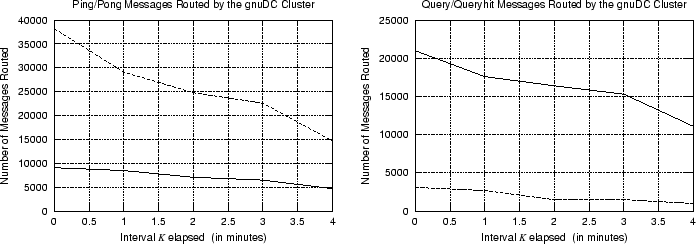
Figure 9 shows a 4 minute snapshot of ping/pong and query/queryhit messages routed through our cluster. There is clearly some analogy between ping/pong and query/queryhit pairs. This is because a ping for instance; will generate many pong messages. (averagely four times as many) while a query will only generate queryhits the one eight of the times. We can also see that there is some relation between the two graphs. This is attributed to the fact that if we have more ping/pong messages (i.e. more hosts) then we will observe also more query/queryhit messages. This implies that users are actually actively searching the network for content. In other words this observation tells us that there are only few or no pathetic peers (i.e. peers that are connected to the network without performing queries).
Each gnuBrick maintains a local Hashtable of all IPs that it has seen before in order to avoid sending duplicate IP addresses to the Index Server. Of course since there is no central coordination of the gnuBricks it is possible that two gnuBricks send the same IP Addresses to the Index Server. In this case the Index Server is responsible to filter out duplicates since it maintains a global view of all IP addresses observed by the system.
For the analysis of the IP Addresses we have written a Multi-Threaded Reverse DNS Lookup (MRDL) engine which finds the DNS entries
of IP addresses obtained by the system. MRDL takes as an input a list of ![]() unique IP addresses , partitions them into
unique IP addresses , partitions them into ![]() buckets, where
buckets, where
![]() is the number of threads that will work towards resolving the IP addresses. After the partition phase the system launches
is the number of threads that will work towards resolving the IP addresses. After the partition phase the system launches ![]() threads which
obtain the DNS entries of the IP addresses they where assigned to. The MRDL engine was operating with 100 threads and we were able to obtain
all DNS entries in a period of two hours.
threads which
obtain the DNS entries of the IP addresses they where assigned to. The MRDL engine was operating with 100 threads and we were able to obtain
all DNS entries in a period of two hours.
The MRDL engine ended up with a set of ![]() resolved IP addresses. An aggregate of
resolved IP addresses. An aggregate of ![]() or
or ![]() were not resolvable.
We mention that the non-resolvable set of IPs contain both hosts which where not reachable at the time of the resolution as well as IP addresses
which are allocated for private networks [19] (i.e.
were not resolvable.
We mention that the non-resolvable set of IPs contain both hosts which where not reachable at the time of the resolution as well as IP addresses
which are allocated for private networks [19] (i.e. ![]() ,
, ![]() and
and ![]() ).
).
In this subsection we wanted to figure out from where the Gnutella users are actually coming from. Clip2 [27] reported in 2000 that Gnutella was a truly international phenomenon. Our measurements indicate similar behavior with a main distinction. We observed that although Gnutella users are coming from around the globe, most of them come from only a few countries (U.S.A., Germany, Canada, France and England).
|
Table 3 presents the top 20 domains from which Gnutella users are coming from (see table 5). Although it was expected that both .net and .com domains will dominate in this measurement, since these domains are globally used by ISPs, we also found that the number of Gnutella users from various domains is more a function of how advanced the networks of the various ISPs in these countries are rather than the actual number of Internet users in these countries. For example we expect that the Australian domain must have far larger number of Internet users than the English domain but the number of Gnutella users are larger for the English domain.
The next table 4 concentrates on only ISPs of the .net and .com domains and tries to determine which of these ISPs are paying the price of the Gnutella Network. In this table we can see that the German ISP (T-Online) contributes with the largest number of IP addresses if we compare it with its rest .net "competitors". In the .com column we can see that the first three ranks are occupied by USA's ISPs.
| ||||||||||||||||||||||||||||||||||||||||||||||||||||||||||||||||||||||
Table 5 presents the overall ranking of ISPs based on their share of Gnutella Hosts they are contributing to the Network. We can see clearly that US, Canadian, German, French and English organizations are dominating the Gnutella network. This table shows that the largest part of the Gnutella network is occupied by only a few countries. The table also reveals that Asian countries that have advanced networks, such as Japan, are not particularly active in this community although their popular Napster-like File Rogue [33] service was suspended.
| ||||||||||||||||||||||||||||||||||||||||||||||||||||||||||||||||||||||||||||||||||||||||||||||||||||||||||||||||||||||||
 |
Our analysis on the network traffic revealed and/or confirmed the following things:
1.0
This document was generated using the LaTeX2HTML translator Version 2K.1beta (1.62)
Copyright © 1993, 1994, 1995, 1996,
Nikos Drakos,
Computer Based Learning Unit, University of Leeds.
Copyright © 1997, 1998, 1999,
Ross Moore,
Mathematics Department, Macquarie University, Sydney.
The command line arguments were:
latex2html -split 0 final
The translation was initiated by csyiazti on 2002-04-29