Hierarchical Clustering of Multiple Choice Questions
Process
Input
Answers (a-f) on 48 questions from 5 quizzes in CS1 (UCR CS10) for
~220 students.
Processing
(The processing scripts and raw data used in this analysis can be
gotten here).
- First I removed those students that didn't take every quiz. This left
125 students.
- Next I calculated the
Mutual Information pairwise for each set of questions to come up
with a similarity measure (higher values mean greater relation). This
yielded a 48x48 matrix of M.I. values.
- Then I performed hierarchical clustering on these values:
- Initialize all questions into singleton clusters
- Repeat n-1 = 47 times:
- Find the two clusters m, n that have the highest similarity
(M.I.)
- Merge those clusters by removing their rows/columns from the
matrix and adding a new row and column where the
ith entry is min(m[i], n[i]) (this means
that the similarity of the new cluster to all of the remaining
clusters is given by the _least_ similar member of the new cluster:
complete-linkage.)
- I then output the resulting hierarchical clustering in the result
format of
DDraw, a Java package to draw dendrograms (also will do
hierarchical clustering in 2-D Euclidean spaces).
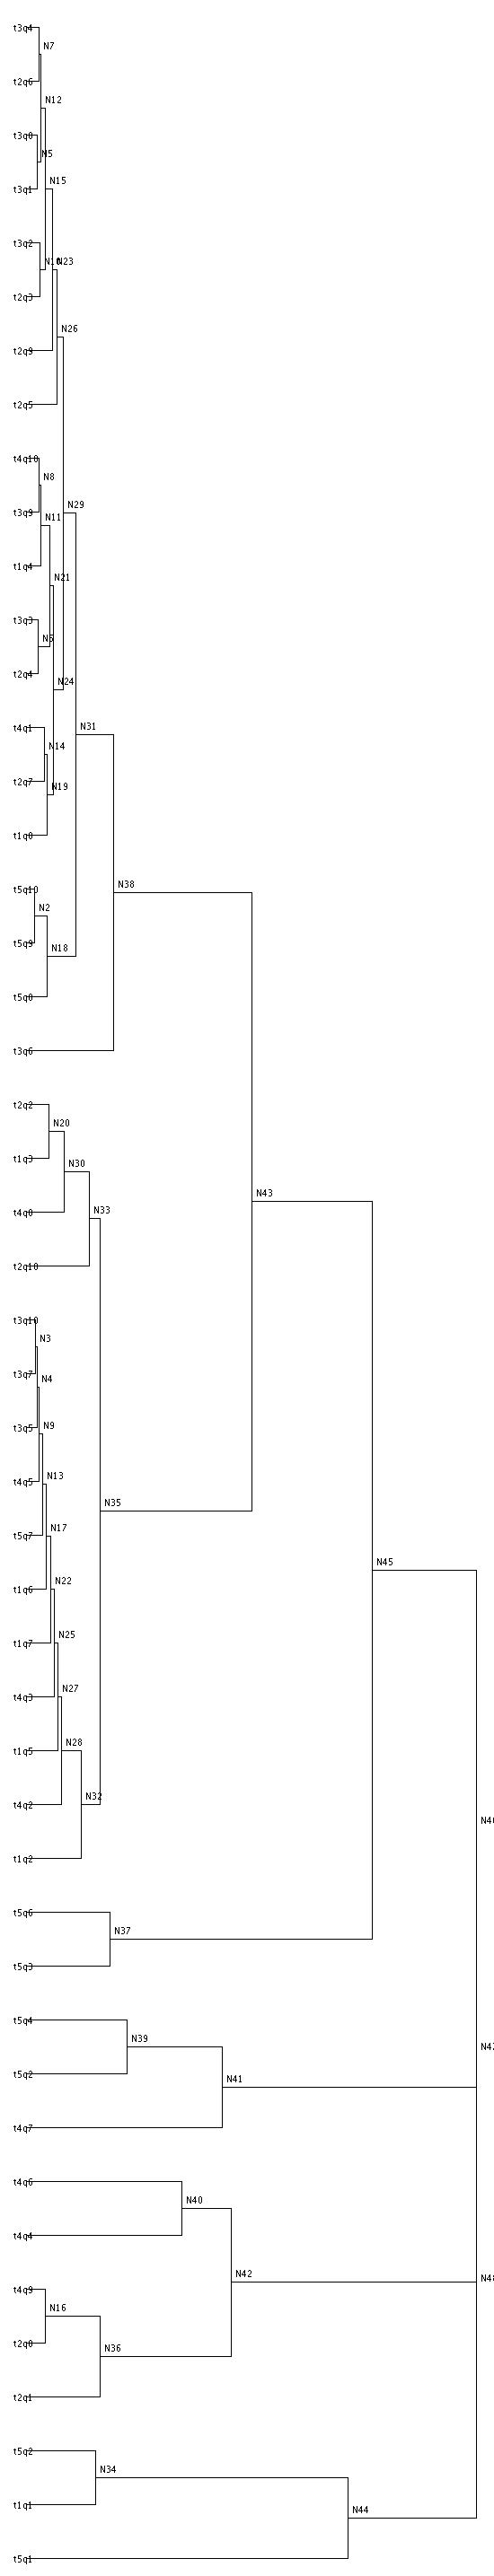
- The resulting tree is shown below. Terminal nodes of the form
tiqj represent the jth question on quiz
i. The text of those questions is below this tree.
- Two nodes that are connected in this tree (such as t3q4 and t2q6,
at the top) are MORE SIMILAR if the horizontal distance between them
is SMALL. Thus, t3q8 and t3q1 are slightly more similar than t3q4 and
t2q6.
- The distances between nodes are being plotted as 1/(MI + 0.1),
since DDraw wants small distances to be good and large to be bad. So
these are in no way linear.
- t5q9 and t5q10 are the best match, with an M.I. of 0.6. (Meaning
if you know a student's score on one of them, you know 0.6 bits of
their score on the other. Since there are 5 choices, a perfect
correlation would be ~2.3 bits.
- t1q1. Secondary storage is substantially bigger and faster than
primary storage. (T/F)
- t1q2. In C++, each statement must be on a separate line. (T/F)
- t1q3. Instructions encoded as numbers, is an example of
- assembly language
- high-level language
- machine language
- t1q4. Choose the correct statement.
- A compiler translates one high-level program instruction at a
time into machine code and immediately executes that code.
- Compilation is the process of translating a source program into an
object program.
- A program written in a high-level language is called an object
program.
- A program that consists of machine language instructions is called
a source program.
- t1q5. Computers are very systematic and can never guess. (T/F)
- t1q6. Planning out an algorithm to solve the required problem is the
first step in programming. (T/F)
- t1q7. What kind of error causes a program to not be able to finish
compiling?
- logic error
- operational error
- semantic error
- syntax error
- computational error
- t1q8. The following shows what kind of error?
#include

using namespace std;

int MAIN()

{

                cout << "This is my first test.\n";

                return 0;

}
- compile-time error
- run-time error
- linking error
- object code error
- No errors
- t2q1. Excessive comments add time to the execution of your
program. (T/F)
- t2q2. Which of the following is NOT a valid identifier
(i.e. CANNOT be used as a name for a variable).
- phone_number
- EXTRACREDIT
- DOUBLE
- my course
- All are invalid
- t2q3. The following is an example of what type of error?
int num1;
int num2;
cout << "Enter two numbers: ";
cin >> num1 >> num1;
- syntax error
- semantic error
- logic error
- compile-time error
- no errors
- t2q4. Which statement has a syntax error?
- double a = 3.5 + 4;
- cout << b + c;
- x + y = total;
- double Main;
- All of the above.
- t2q5. What is the output of the following statement?
int num = 26;

cout << "Here it is." << num << "\nThere it is.";
- Here it is.There it is.
- Here it is.26nThere it is.
- Here it is.26
There it is.
- Here it is.
26
There it is.
- Here it is.26\nThere it is.
- t2q6. Assuming that the user types 14.92 followed by a return, what is the output of the following code:
int num;
cout << "Enter a number:  ";
cin >> num;
cout << num;
- 0
- 14
- 14.92
- 15
- None of the above
- t2q7. What is the result of the following code:
int a = 53;
int b = 6;
cout << a / b;
- 8.833
- 9
- 8
- 5
- None of the above
- t2q8. We want to translate the following algebraic expression into
a C++ arithmetic expression. Which of the following is the correct
form?
 1      1-a
--- + --------
 c      1+b
- 1 / c + 1 - a / 1 + b
- 1 / c + (1 - a / 1 + b)
- (1 / c) + (1 - a / 1 + b)
- 1 / c + (1 - a) / (1 + b)
- None of the above
- t2q9. What is the result of the following arithmetic expression?
7.0 * 3 % 2
- 7.0
- 0
- 1.0
- 10.5
- invalid expression
- t2q10. All three statements below have the same effects.
a = a + 1;
a = (a+1);
a = 1 + a;
(T/F)
- t3q1. What is the output of the following code?
int a = 28;
int b = 19;
int c = 3;
int d = 2;
cout << a % b % c / d;
- 1.5
- 1
- 0.25
- 0
- None of the above
- t3q2. What is the output of the following code?
int a = 9;
int b = 6;
double c = 2.2;
cout << 4.4 + c * (a / b);
- 7.7
- 6.6
- 9.9
- 11
- None of the above
- t3q3. What is the output of the following code?
string fun = "I love C++";
cout << fun.length();
- 1
- 9
- 10
- 8
- None of the above
- t3q4. Given that str = "Snoozing under a tree", what would
be the result of the following statement
cout << str.substr(1, 1) + str.substr(9, 2);
- Sun
- nun
- nnd
- S u
- None of the above
- t3q5. What does the following output produce? (Note: a dash is
representing a space.)
double x = 1.0;
double y = 777.777;
cout << fixed << setprecision(2) << setw(8);
cout << x << "\n";
cout << y << "\n";
- ----1.00
777.78
- -------1
777.78
- ----1.00
--777.78
- ----1.00
777.777
- None of the above
- t3q6. The Point type is built into the C++ language. (T/F)
- t3q7. What is the value of c.get_center and c.get_radius after the
following code?
Circle c(Point(-1, 2), 4);
c.move(3, 2);
- (-4, 4) and 4
- (4, 0) and 2
- (2, 0) and 4
- (2, 4) and 4
- None of the above
- t3q8. The following code has what kind of error?
Time morning(7, 0, 0);
cout << Time.get_hours();
- logic
- syntax
- run-time
- operational
- No errors
- t3q9. The following code has an error on which line?
Line 1               Point p(0,0);
Line 2               Point q(3,3);
Line 3               Line stick(p, q);
Line 4               cwin << get_start();
- Line 1
- Line 2
- Line 3
- Line 4
- No errors
t3q10. What type of character does the following code display?
Point p(2,4);
Line s(p, Point(4, 4);
cwin << s;
p.move(0,2);
Point q = p;
q.move(0, -4);
cwin << Line(p, q);
p.move(2, 0);
q.move(2, 0);
cwin << Line(p, q);
- U
- T
- H
- E
- None of the above
t4q1. Which statement would use the following coordinate system?

- cwin.coord(40, 10, -20, 50);
- cwin.coord(-20, 40, 10, 50);
- cwin.coord(-20, 50, 10, 40);
- cwin.coord(10, 40, -20, 50);
- cwin.coord(-20, 40, 50, 10);
t4q2. The following is a valid statement.
cwin << Point(0, cwin.get_int("What is your favorite number?"));
(T/F)
t4q3. If the condition in an if structure is FALSE, the program
will end. (T/F)
t4q4. Using an assignment operator in the condition of an if
structure will result in a syntax error. (T/F)
t4q5. Given the format of the if-else structure below, one and
only one of the statement sets inside of the bodies of the if and else
will be executed.
if (------)
{
            stmt set 1;
}
else
{
            stmt set 2;
}
(T/F)
t4q6. Given the following code, what will be the output, assuming
the user enters 14.25.
int num;
cout << "Enter an integer: ";
cin >> num;
if (cin.fail())
{
            cout << "Output 1\n";
}
else
{
            cout << "Output 2\n";
}
- Output 1
- Output 2
t4q7. Given the code from the above question, what will be the
output, assuming the user enters .11.
- Output 1
- Output 2
t4q8.Given the following code, and that the user entered the
string "Goodbye", what will be the output?
string str = "Hello";
string word;
cout << "Enter a word:  ";
cin >> word;
if (word < str)
{
    str = word;
}
cout << str;
- Hello
- Goodbye
- None of the above
t4q9. Given the following code, what will be the output?
int x = 1;
int y = 2;
if (x < y)
{
      cout << x;
}
cout << y;
- 1
- 2
- x
- y
- 12
t4q10. What will be the output of the following code segment?
int x = 0;
int y = 3;
if (x < 1)
{
            cout << "stmt 1  ";
            x = y;
}
if (x > 1)
{
            cout << "stmt 2  ";
}
else
{
            cout << "stmt 3  ";
}
- stmt 1
- stmt 2
- stmt 1 stmt 2
- stmt 1 stmt 2 stmt 3
- stmt 1 stmt 3
t5q1. Parameters and return types can only be fundamental types. (T/F)
t5q2. A return statement always terminates the program. (T/F)
t5q3. Assuming that x is a double, the following statement is a
valid statement.
cout << sqrt(pow(x, 4));
(T/F)
For the next 3 questions, assume there is a the following function
header (prototype):
void func(int, double)
t5q4. Given the function func above, the following statement is valid.
cout << func(4, 13.9);
(T/F)
t5q5. Given the function func above, the following statement is valid.
func(rand(), 2.2);
(T/F)
t5q6. Given the function func above, the following statement is valid.
func(7.7, 11);
(T/F)
t5q7. The expression rand() % 50 + 10 would result in a
range of
- 0-49
- 1-50
- 10-50
- 10-59
- None of the above
Use the code below for the next 3 questions.
double func1(double x)
{
            if (x <= 20)
            {
                        return x;
            }
            else
            {
                        return 100;
            }
}

double func2(double a)
{
            double b = pow(a, a);
            cout << b << endl;                               // OUTPUT 1

            double c = func1(b);
            cout << c << endl;                                // OUTPUT 2

            return b + c;
}

int main()
{
            cout << func2(3) + 5 << endl;              // OUTPUT 3
            return 0;
}
t5q8. What will OUTPUT 1 print?
- 3
- 9
- 27
- 32
- None of the above
t5q9. What will OUTPUT 2 print?
- 3
- 20
- 27
- 100
- None of the above
t5q10. What will OUTPUT 3 print?
- 8
- 41
- 127
- 132
- None of the above